03 – THE PHASE ADDITION METHOD TO EVALUATE RIETVELD MINERAL QUANTITATIVE ANALYSIS OF HYDRATED CEMENTS
Ano 07 (2020) – Número 02 Artigos
![]() 10.31419/ISSN.2594-942X.v72020i2a3LBAN
10.31419/ISSN.2594-942X.v72020i2a3LBAN
Leonardo Boiadeiro Ayres Negrão1, Prof. Dr. Herbert Pöllmann2
1,2Institute of Geosciences and Geography, Mineralogy/Geochemistry, Martin Luther University Halle-Wittenberg, Von-Seckendorff-Platz 3, 06120 Halle, Germany
1boiadeiro.negrao@gmail.com
2herbert.poellmann@geo.uni-halle.de
ABSTRACT
X-ray powder diffraction (XRPD) analysis combined with the Rietveld method is commonly used in the mineralogical quantification of a range of different samples, including soil, rocks, and many industrial materials. The combination of this technique with the addition method, i.e. the successive addition of a mineral phase to the investigated sample, offers a simple and reliable method to test Rietveld results without the need for third techniques. Four different hydrated cement samples were successive mixed (at 1, 5, and 10%) with one of the main mineral-related phases (ettringite, larnite, ternesite, or ye’elimite) occurring in them. The Rietveld quantified amounts of these phases show a very good agreement with their added amounts, all resulting in regression lines with R2>0.99. The respective line equations permitted the calibration of the quantified amounts of the studied mineral phases, which presented standard deviations lower than 0.3.
Keywords: Rietveld; addition method; hydrated cement, calcium sulphoaluminate.
INTRODUCTION
XRPD Rietveld analysis (Rietveld, 1969) is currently one of the most used techniques to quantify mineral phases of diverse solid materials (Kniess et al., 2005), including natural samples of soils (Brinatti et al., 2010; Negrão et al., 2018a), rocks (Negrão et al., 2018b), industrial products such as cements (Aranda et al., 2012; Schmidt and Pöllmann, 2000), ceramics, and industrial residues. The Rietveld method is based on the fitting of an experimental XRPD pattern to a calculated one, which is obtained from the theoretical crystal structures of each containing mineral phase in the analyzed sample (Young, 1993). This fitting is performed by a least square approach that calculates the difference between the observed (raw) and calculated diffracted peak intensities of mineral phases. A more comprehensive and detailed description concerning Rietveld analysis is reported by (Mccusker et al., 1999; Rietveld, 2014; Young, 1993).
The quality of a Rietveld refinement can be evaluated by the Rietveld-derived indices R-weighted profile (Rwp) and Good of fitness (GOF) and by a careful evaluation of the fitted X-ray diffracted pattern (Toby, 2006). Whereas, the reliability of the results is normally proven using independent methods. Rietveld quantified contents of the phases in a sample can be stoichiometric back-calculated and confronted with independent chemical analysis (i.e. by X-ray fluorescence spectrometry or inductive coupled plasma mass spectrometry). Likewise, scanning electron microscopy coupled with energy dispersive spectroscopy (SEM-EDS) can also appear as an interesting tool, and, thermogravimetric analysis proof the mineral contents of mineral phases with structural water or carbonates, by its loss by evaporation. The mentioned techniques are both used to support and proof Rietveld analysis. But the precision and accuracy of a Rietveld mineral quantification depend on many other factors, such as the crystalline aspects of each mineral phase, potential peak overlapping, possible microabsorption effects, the preferred orientation of crystallites, and the choose instrumental conditions (Mccusker et al., 1999).
To evaluate the accuracy of the method for a specific mineral, this phase can be successively added to the sample in different amounts and quantified using the Rietveld method, to build a calibration curve (Figure 1). This method, referred to as the addition method (Balić-Žunić, 2002), has an advantage to test the Rietveld method for specific phases in a mixture, without the need for the addition of third variables or use of time (and cost)-consuming other methods. The addition method is already used in many techniques to build calibration curves, including for semi-quantitative analysis of minerals by plotting the relative intensity of the main reflexes of mineral phases again their added amounts (Young, 1993).
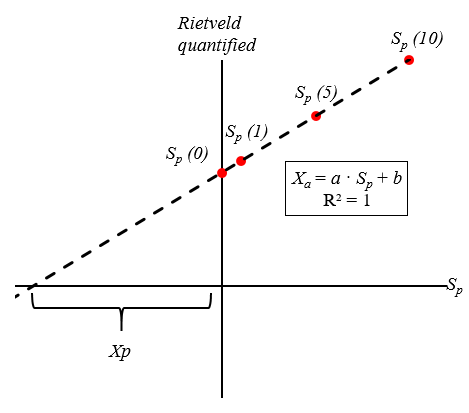
Figure 1 Graphical explanation of the addition method combined with the Rietveld quantification. The plot presents the Rietveld quantified results as a function of the known amount (Sp) of the added phase p, in this example 0, 1, 5, and 10. Sp (0) corresponds to the original amount of the phase without addition. The calibrated amount of phase p in the original sample will be Xp. The calibration curve will represent a linear function in the form Xp = a · Sp + b. In a perfect agreement (R2=1), a=1 and the corrected amount of the phase p in the original sample (without addition, Sp = 0), is Xp = b.
We used the addition method to evaluate the accuracy of Rietveld-quantified main phase contents in calcium sulphoaluminate-based cements (CSA). Even though this study was carried out with cement samples, the same methodology can be applied for any other natural or synthetic material. The results bring insight into the importance of a self-data analysis validation.
MATERIAL AND METHODS
Four different hydrated CSA were used, CSA-1, CSA-2, SA-3, and CSA-4. The hydrated cements were measured after 72 h curing and are result of recent research works of the authors to be published elsewhere. Each cement was mixed respectively with one of the main mineral phases occurring in the sample: ettringite, larnite, ternesite, and ye’elimite. The pure phases were sintered in the laboratories of the Research Group Mineralogie of the Martin-Luther Halle-Wittenberg Universität. Rutile (from Kronos, reference code 3025) was used as an internal standard to quantify the X-ray amorphous – amorphous fraction or refinement miss-fittings.
The mixtures were weighted, carefully homogenized using an agate mortar and pestle, and prepared by backloading in 16 mm-diameter sample holders. The XRPD analysis was carried out with a PANalytical X’Pert Pro MPD X-ray diffractometer, equipped with a Cu anode and linear X’Celerator RTMS detector set in the θ-θ Bragg-Brentano-Geometry. The measuring conditions were from 5 to 70° 2θ, 0.013° step size, and counting time of 38 seconds per step. The mineral characterization and quantification were performed with the software HighScore Plus 4.5. The crystallographic information files (.cif) used in the refinements are listed in Table 1. All the samples were prepared and measured in triplicate.
Table 1 Phases and their respective ICSD code used in the Rietveld refinements.
| Phase | Chemical Formula | Space group | ICSD code | Authores | |
|---|---|---|---|---|---|
| Anhydrite | CaSO4 | Cmcm | 16382 | (Kirfel and Will, 1980) | |
| Brownmillerite | Ca2(Al,Fe)2O5 | Ima2 | 9197 | (Colville and Geller, 1971) | |
| Ettringite | Ca6Al2(SO4)3(OH)12•26(H2O) | P31c | 16045 | (Moore and Taylor, 1970) | |
| Gehlenite | Ca2Al(Al,Si)O7 | P-421m | 87144 | (Louisnathan, 1971) | |
| Hemicarboaluminate | Ca4Al2(OH)12)OH(CO3)0.5•4(H2O) | R-3c | 263124 | (Runčevski et al., 2012) | |
| Kuzelite | Ca4Al2(OH)12(SO4)•6(H2O) | R-3 | 100138 | (Allmann, 1977) | |
| Larnite | Ca2(SiO4) | P21/c | 39006 | (Udagawa and Urabe, 1978) | |
| Lime | CaO | Fm-3m | 60704 | (Jay and Andrews, 1946) | |
| Fe-perovskite | Ca4Ti2.0Fe1.6O11.2 | Pnma | 96683 | (Dunyushkina and Gorbunov, 2002) | |
| Rutile | TiO2 | P42nmn | 88626 | (Gesenhues and Rentschler, 1999) | |
| Strätlingite | Ca2Al2(SiO2)(OH)10•2.5(H2O) | R-3m | 431951 | (Santacruz et al., 2016) | |
| Ternesite | Ca5(SiO4)2(SO4) | Pnma | 85123 | (Irran et al., 1997) | |
| Ye’elimite | Ca4Al6(SO4)O12 | Pcc2 | 237892 | (Cuesta et al., 2013) |
RESULTS AND DISCUSSIONS
The Rietveld quantifications of the clinkers present a reasonable good fit between the calculated profile and the raw data, indicating that all the relevant present diffraction peaks were correctly addressed in the Rietveld treatment (Figure 2). The goodness-of-fit (GOF) is close to 1 (Table 2) and also indicates that the model is plausible (Toby, 2006). All the studied samples have ettringite as the main phase, followed by kuzelite, straetlingite, hemicarboaluminate, ternesite, larnite, gehlenite, brownmillerite, and perovskite.
Table 2 Triplicate average of Rietveld-quantified contents in the clinkers CSA-1, CSA-2, CSA-3 and CSA-4, and Rietveld-indices GOF and Rwp. Standard deviation values are in parenthesis. The phases in bold are the investigated ones.
| Phases | CSA-1 | CSA-2 | CSA-3 | CSA-4 |
| ettringite | 18.9 (0.7) | 16.0 (0.6) | 28.3 (0.5) | 41.8 (1.1) |
| larnite | 19.8 (0.6) | 13.2 (0.4) | 11.0 (1.1) | 12.8 (1.1) |
| ternesite | – | 18.8 (0.5) | 16.9 (0.6) | 16.6 (1.4) |
| kuzelite | 7.3 (0.6) | 10.3 (0.8) | 5.0 (0.6) | 1.7 (0.3) |
| straetlingite | 5.9 (0.6) | 1.2 (0.9) | – | – |
| brownmillerite | 2.2 (0.6) | 3.4 (0.1) | 2.7 (0.2) | 3.2 (0.5) |
| perovskite | 2.4 (0.1) | 2.6 (0.2) | 2.1 (0.2) | 2.1 (0.6) |
| gehlenite | 4.5 (0.4) | – | – | – |
| hemicarboaluminate | 5.2 (0.8) | 6.0 (1.5) | 4.4 (0.1) | – |
| ye’elimite | 0.9 (0.2) | 0.7 (0.5) | 1.5 (0.4) | 2.8 (0.2) |
| amorphous | 32.9 (1.3) | 28 (1.9) | 28.3 (1.4) | 19.2 (2.3) |
| GOF | 1.2 | 1.3 | 1.3 | 1.5 |
| Rwp | 7.4 | 7.9 | 7.9 | 9.1 |
Ettringite is the main phase formed by the hydration of CSA cements, that have ye’elimite as the main reactive clinker-phase (Winnefeld et al., 2017). Kuzelite, hemicarboaluminate and straetlingite are other hydration products resulting from the complex hydration of the clinker, that won’t be disscussed in this text. And, finally, ternesite, larnite, gehlenite, brownmillerite, and perovskite are original clinker phases with hydraulic activity much lower than ye’elimite. The high amount of amorphous is expected in hydrated cement pastes.
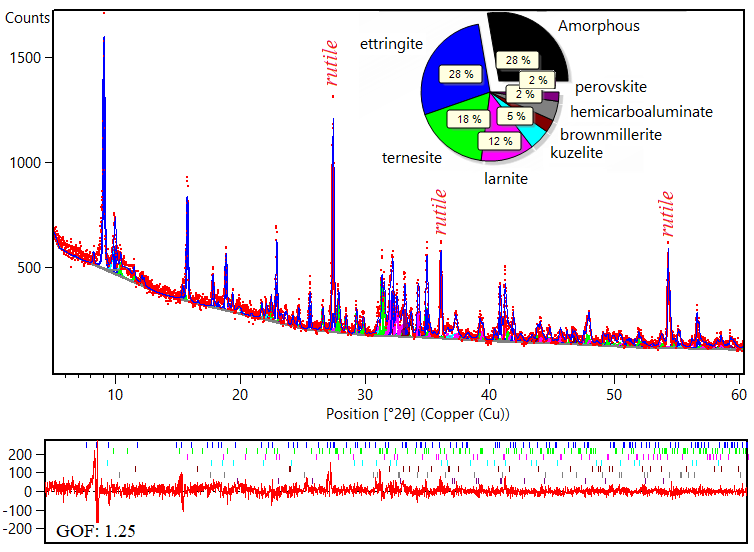
Figure 2 Rietveld refined X-ray diffractogram of the hydrated cement CSA-3. Rutile was added as internal standard for the amorphous quantification.
In Figure 2, the X-ray patterns of a sample mixed with increasing amounts of ye’elimite are shown. The original sample is composed of only a small amount of ye’elimite (firstly quantified as 2.8%), and the successive ye’elimite amounts are visually in agreement with the observed patterns. Note that only the changes in the intensity of the ye’elimite peaks are observed, whereas the others have the same intensity, an indication that the sample preparation is not influencing the results.
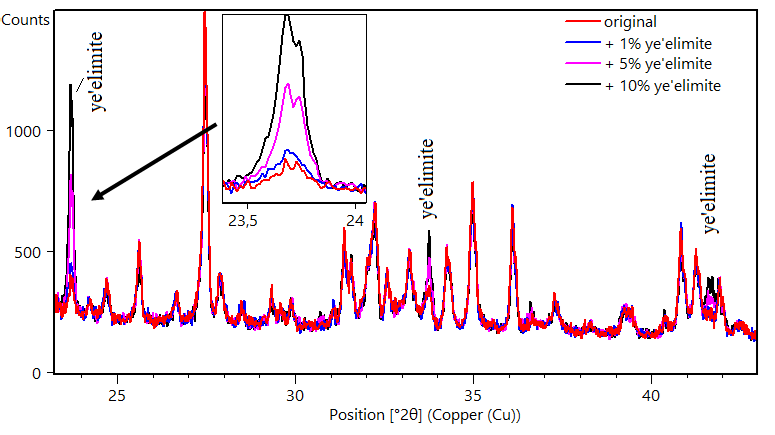
Figure 3 X-ray diffractograms of hydrated cements CSA-4 with different added amounts of ye’elimite. The amount of quantified ye’elimite in the original sample (without additions) was 2.8%.
The additions of the main phases ettringite, ternesite, larnite, and ye’elimite are well correlated with the Rietveld quantified amounts of these phases in the samples. The plots of the quantified phase vs. its added amounts show good correlations (R2>0.99), while in an idealized situation the plotted contents would perfectly fit in a regression line with R2=1 (i.e. Figure 1). The main discrepancy is observed for the added amounts of 1%, a very low amount that might fall within expected absolute errors of the Rietveld refinement (Bish and Howard, 1988). Other than that, many factors that influence the quality of a Rietveld refinement can influence the results, including the symmetry and/or the crystallinity (order) of the phases and the preferred orientation of minerals. Therefore, the results seem to be better for ye’elimite (R2=0.9995), a pseudocubic (orthorhombic) clinker-phase, than for ettringite (R2=0.9903) that has its large prisms (Figure 5) easily preferred oriented along the [100] crystallographic axis (Aranda et al., 2017).
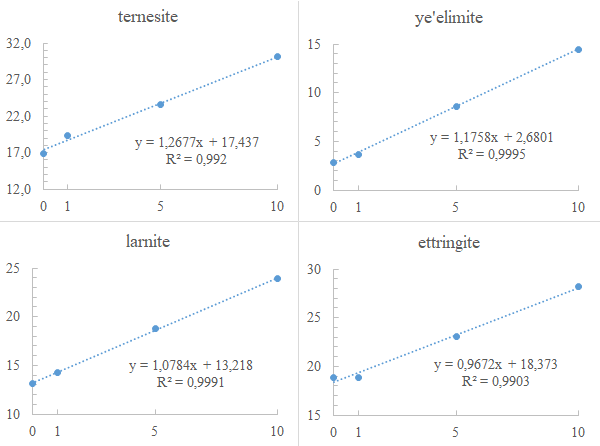
Figure 4 Plots of Rietveld quantified (y-axis) and added amounts (x-axis) of the selected phases of CSA cements.
Using the derived line equations (Figure 4) is possible to obtain a calibrated amount of each quantified phase in its respective sample without addition. The calibrated content of the phases and its respective standard deviation (σ) concerning the quantified amounts without additions (as expressed in Table 2) are, as follows:
- 437% for ternesite, σ = 0.27;
- 6801% for ye’elimite, σ = 0.06;
- 218% for larnite, σ = 0.03;
- 373% for ettringite, σ = 0.26.
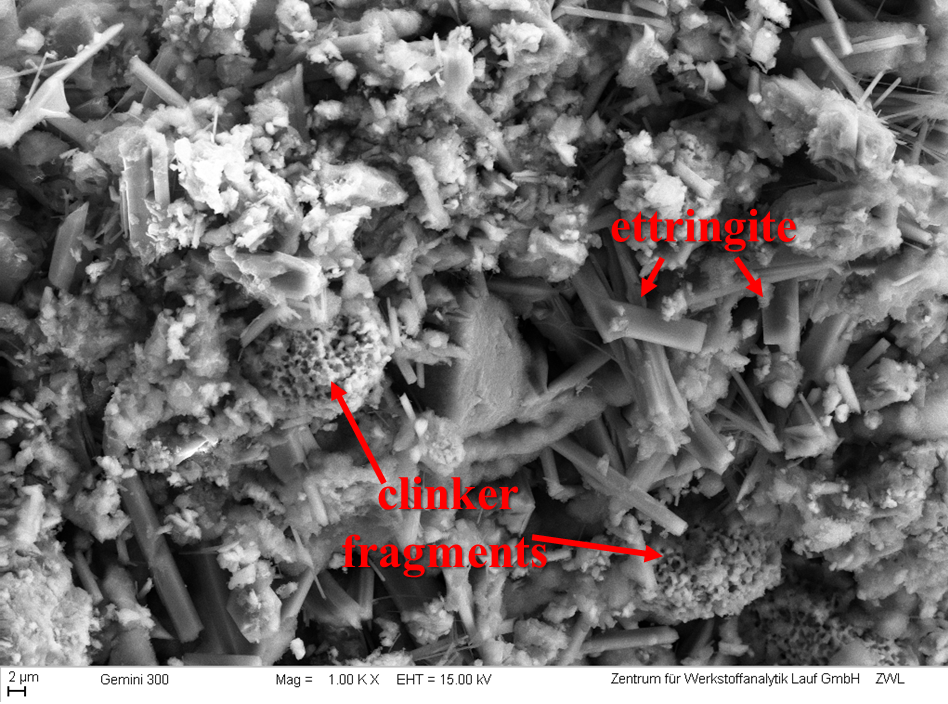
Figure 5 SEM image of the hydrated cement CSA-1 showing some clinker fragments (mainly composed of larnite), and larger prisms of ettringite. Image acquired at Zentrum für Werkstoffanalytik Lauf (ZWL) in Lauf, Germany.
CONCLUSIONS
Rietveld analysis’s evaluation can be made by adding successive amounts of the main analyzed crystalline phases occurring in the sample. The addition method is useful to test the accuracy of the Rietveld results and for self-data analysis validation, by verifying simultaneously the quality of the fitted profile and the constructed calibration curve. The simplicity of the method is highlighted as no third-method is needed for this verification, since one has the investigated crystalline phase available as pure for the additions. The quality of the results will obviously be strongly depend on proper sample preparation for the XRPD analysis and particularities of the sample (crystallinity of the phases, the quantity of amorphous, etc.).
Acknowledgments
The authors thanks the financial support of the Brazilian CAPES foundation through the grant 88881.199654/2018-01 (first author), and to the Zentrum für Werkstoffanalytik Lauf for the support in the microscopic analysis.
REFERENCES
Allmann, R., 1977. Refinement of the hybrid layer structure hexahydroxoaluminodicalcium hemisulfate trihydrate [Ca2Al(OH)6]+.[1/2SO4.3H2O]-. Neues Jahrb. fuer Mineral. Monatshefte.
Aranda, M.A.G., Cuesta, A., De la Torre, A.G., Santacruz, I., León-Reina, L., 2017. Diffraction and crystallography applied to hydrating cements, in: Cementitious Materials: Composition, Properties, Application. https://doi.org/10.1515/9783110473728-003
Aranda, M.A.G., De La Torre, Á.G., León-Reina, L., 2012. Rietveld quantitative phase analysis of OPC clinkers, cements and hydration products. Rev. Mineral. Geochemistry. https://doi.org/10.2138/rmg.2012.74.5
Balić-Žunić, T., 2002. Quantitative powder diffraction phase analysis with a combination of the Rietveld method and the addition method. Powder Diffr. 17, 287–289. https://doi.org/10.1154/1.1523872
Bish, D.L., Howard, S.A., 1988. Quantitative phase analysis using the Rietveld method. J. Appl. Crystallogr. https://doi.org/10.1107/S0021889887009415
Brinatti, A.M., Mascarenhas, Y.P., Pereira, V.P., Partiti, C.S. de M., Macedo, Á., 2010. Mineralogical characterization of a highly-weathered soil by the rietveld method. Sci. Agric. https://doi.org/10.1590/s0103-90162010000400013
Colville, A.A., Geller, S., 1971. The crystal structure of brownmillerite, Ca2FeAlO5. Acta Crystallogr. Sect. B Struct. Crystallogr. Cryst. Chem. https://doi.org/10.1107/s056774087100579x
Cuesta, A., De La Torre, A.G., Losilla, E.R., Peterson, V.K., Rejmak, P., Ayuela, A., Frontera, C., Aranda, M.A.G., 2013. Structure, atomistic simulations, and phase transition of stoichiometric yeelimite. Chem. Mater. https://doi.org/10.1021/cm400129z
Dunyushkina, L.A., Gorbunov, V.A., 2002. Crystal structure and electrical conductivity correlation in CaTi 1-xFexO3-δ system, in: Ionics. https://doi.org/10.1007/BF02376076
Gesenhues, U., Rentschler, T., 1999. Crystal Growth and Defect Structure of Al3+-Doped Rutile. J. Solid State Chem. https://doi.org/10.1006/jssc.1998.8088
Irran, E., Tillmanns, E., Hentschel, G., 1997. Ternesite, Ca5(SiO4)2SO4, a new mineral from the Ettringer Bellerberg/Eifel, Germany. Mineral. Petrol. https://doi.org/10.1007/BF01163138
Jay, A.H., Andrews, K.W., 1946. Note on Oxide Systems Pertaining to Steel-making Furnace Slags. J. Iron Steel Inst., London.
Kirfel, A., Will, G., 1980. Charge density in anhydrite, CaSO 4 , from X-ray and neutron diffraction measurements . Acta Crystallogr. Sect. B Struct. Crystallogr. Cryst. Chem. https://doi.org/10.1107/s0567740880010461
Kniess, C.T., Cardoso de Lima, J., Prates, P.B., 2005. The quantification of crystalline phases in materials: Applications of Rietveld method. Sinter. – Methods Prod.
Louisnathan, S.J., 1971. Refinement of the crystal structure of a natural gehlenite, Ca 2 Al(Al,Si) 2 O 7. Can. Mineral. 10, 822–837.
Mccusker, L.B., Von Dreele, R.B., Cox, D.E., Louër, D., Scardi, P., 1999. Rietveld refinement guidelines. J. Appl. Crystallogr. https://doi.org/10.1107/S0021889898009856
Moore, A.E., Taylor, H.F.W., 1970. Crystal structure of ettringite. Acta Crystallogr. Sect. B 26, 386–393. https://doi.org/10.1107/S0567740870002443
Negrão, L.B.A., Costa, M.L. da, Pöllmann, H., 2018a. The Belterra Clay on the bauxite deposits of Rondon do Pará, Eastern Amazon. Brazilian J. Geol. 48, 473–484. https://doi.org/10.1590/2317-4889201820180128
Negrão, L.B.A., Costa, M.L. da, Pöllmann, H., Horn, A., 2018b. An application of the Rietveld refinement method to the mineralogy of a bauxite-bearing regolith in the Lower Amazon. Mineral. Mag. 82, 413–431. https://doi.org/10.1180/minmag.2017.081.056
Rietveld, H.M., 2014. The Rietveld method. Phys. Scr. https://doi.org/10.1088/0031-8949/89/9/098002
Rietveld, H.M., 1969. A profile refinement method for nuclear and magnetic structures. J. Appl. Crystallogr. https://doi.org/10.1107/s0021889869006558
Runčevski, T., Dinnebier, R.E., Magdysyuk, O. V., Pöllmann, H., 2012. Crystal structures of calcium hemicarboaluminate and carbonated calcium hemicarboaluminate from synchrotron powder diffraction data. Acta Crystallogr. Sect. B Struct. Sci. https://doi.org/10.1107/S010876811203042X
Santacruz, I., De La Torre, Á.G., Álvarez-Pinazo, G., Cabeza, A., Cuesta, A., Sanz, J., Aranda, M.A.G., 2016. Structure of stratlingite and effect of hydration methodology on microstructure. Adv. Cem. Res. https://doi.org/10.1680/adcr.14.00104
Schmidt, R., Pöllmann, H., 2000. Quantification of calcium sulpho-aluminate cement by Rietveld analysis. Mater. Sci. Forum.
Toby, B.H., 2006. R factors in Rietveld analysis: How good is good enough? . Powder Diffr. https://doi.org/10.1154/1.2179804
Udagawa, S., Urabe, K., 1978. Crystal Structure of modifications of calcium silicate Ca2SiO4 and their phase transformation. Semento Hijutsu Nempo, SGNEA 32, 35–38.
Winnefeld, F., Martin, L.H.J., Müller, C.J., Lothenbach, B., 2017. Using gypsum to control hydration kinetics of CSA cements. Constr. Build. Mater. https://doi.org/10.1016/j.conbuildmat.2017.07.217
Young, R.A., 1993. Introduction to the Rietveld method, in: The Rietveld Method.