01 – ANALYSIS OF PURINIC ALKALOIDS BY XRD AND MOLECULAR MODELING METHODS
Ano 08 (2021) – Número 01 Artigos
![]() 10.31419/ISSN.2594-942X.v82021i1a1JARR
10.31419/ISSN.2594-942X.v82021i1a1JARR
José de Arimateia Rodrigues do Rego1*, Jorddy Neves Cruz1, Marcondes Lima da Costa2, Fabrine Silva Alves3, Isaque Gemaque de Medeiros1, Gleice Vasconcelos da Silva Pereira5, Maria Janes de Oliveira Santos3, Pabllo Henrique Costa dos Santos2, Alessandra Santos Lopes5, Davi do Socorro Barros Brasil4.
1Programa de Pós-Graduação em Química, Federal University of Pará (UFPA), jr2rego@gmail.com
2Instituto de Geociências, Federal University of Pará (UFPA);
3Programa de Pós-Graduação em Inovação Farmacêutica. Federal University of Pará (UFPA);
4Instituto de Tecnologia, Federal University of Pará (UFPA);
5Programa de Pós-Graduação em Engenharia de Alimentos, Federal University of Pará (UFPA).
*Corresponding author.
Received December 28, 2020
Revised January 17, 2021
Accepted March 22, 2021
ABSTRACT
Theophylline, theobromine and caffeine, are purine-based alkaloids in which the main differentiation in the molecular structure is the presence of methyls, one, two and three, respectively in these substances. This study presents an analysis by XRD and molecular modeling methods of the alkaloid’s caffeine and theobromine. The crystalline structure of caffeine was characterized as a monoclinic system, and the diffractogram of the caffeine crystals showed peaks with regions of greater intensity at 2θ = 11.7616 ° (d = 7.51 Å; I% = 80.13) and 2θ = 11.9416 ° (d = 7.40 Å; I% = 98.14). In the diffractogram of the theobromine crystal sample, peaks of greater intensity occurred in the regions 2θ = 13.4616 ° (d = 6.57 Å; I% = 98.92) and 2θ = 27.0816 ° (d = 3, 28 Å; I% = 67.23). Results obtained by XRD for caffeine and theobromine were compatible with standard cards of the X’Pert High Score Plus® program. The presence of an extra methyl in the structure of the caffeine purine base, suggests, a shift in the values of the angle 2 θ for the main peaks of theobromine, as well as an increase in intensity, mainly in 27.016, theobromine also presents a peak in the region 10.6 which does not occur in caffeine. Statistical results reveal that the linear models for data of peaks of specific angles in 2θ of the samples, presented good linear correlation (R2> 98%) and satisfactory results after the procedure of cross validation. caffeine and theobromine also showed important differences in interactions with adenosine A2AR, particularly in hydrophobic and hydrogen interactions.
Keywords: caffeine, theobromine, XRD, biological receptors
INTRODUCTION
X-ray diffraction analyzes are used to determine amorphous and crystalline phases, residual stress, thin films, reflection and texture, in addition to studies of phase transformation, kinetic reaction and stress behavior with temperature, with the aid of high temperature (Chung and Smith, 1999).
The determination of the crystalline phase is possible due to the particular ordered arrangement of each crystal, which differentiates it from amorphous solids, gases and liquids, whether these structures are inorganic or organic. Apparently, the crystals acquire this form to obtain the minimum energy, thus denominating the external conformation of the crystal (Zarbin, 2007).
Despite the use of X-Ray Diffraction (XRD) as an analytical method for identifying crystal structures of alkaloids, it is still little used, and XRD is indicated for the definition of crystalline phases from crystalline solids (Ameh, 2019), identification studies and differentiation of alkali crystals must be performed.
Alkaloids are nitrogenous organic substances, comprising a heterogeneous group of low molecular weight, of basic character, usually of vegetable origin, which cause characteristic physiological effects in animal organisms, thus, presenting several pharmacological actions (Dewick, 2009).
In this sense, the presence of one or more nitrogen atoms, typically as primary, secondary or tertiary amines, gives the alkali a basic character, which facilitates its isolation and purification (Dewick, 2009).
Among the various alkaloids extracted from plants, we can highlight the xanthines, found in most tissues and body fluids of certain plants and some urinary stones. Puric alkaloids are secondary metabolites derived from xanthine, known as false alkaloids, because they do not directly derive from an amino acid (Debnath et al., 2018; Caudle & Bell, 2001). In this group of compounds, caffeine and theobromine stand out, several studies on these alkaloids present images, in solid state, including their crystals.
Caffeine is a trimethylxanthine in which the three methyl groups are located in positions 1, 3 and 7. Purine alkaloid that occurs naturally in tea and coffee (De Maria & Moreira, 2007).
The xanthine alkaloid, caffeine, which occurs in plant sources, such as tea leaves, coffee beans, cocoa beans; it has a bitter taste and is generally isolated in the form of white acicular crystals. By chemical treatment, in extractions sequenced by organic solvents, acids and bases, as well as drying and sublimation processes, the caffeine crystals appear in brilliant acicular formations, gathered in fuzzy masses (Vijayakumar et al., 2014).
Theobromine (3,7-dimethylxanthine) is the main alkaloid in Theobroma cacao (the cocoa bean) and other plants. Xanthine alkaloid used as a bronchodilator and vasodilator. It has a weaker diuretic activity than theophylline and is also a less powerful smooth muscle stimulant. It has practically no stimulating effect on the central nervous system. Previously, it was used as a diuretic and in the treatment of angina pectoris and hypertension (Buckley. 1989).
Theobromine is an immediate precursor of caffeine, which is also involved in caffeine catabolism, accumulates in the leaves of the coffee tree (Silvarolla, 2004; Mazzafera, 2009). This compound is one of the main alkaloids found in cacao fruits (Theobroma cacao).
Studies by Vijayakumar and collaborators (2014) bring the image of caffeine, in acicular crystals, slightly defined. The studies by Grases & Costa-Bauza (2014) show images of theobromine crystals in Scanning Electron Microscopy.
Xanthine alkaloids, such as caffeine and theobromine, can be crystallized through unit operations that involve the separation of a solid phase from a liquid phase system. This operation is performed on approximately 70% of chemical compounds by the chemical and pharmaceutical process industries (Teixeira, 2014; Tewari et all.,2012.).
Due to the fact that several chemical substances are found in the solid state, a wide variety of analytical techniques can be used for studies of analytical characterization of these chemical compounds, such as: thermogravimetry (TG), scanning electron microscopy (SEM), exploratory differential calorimetry (DSC), powder method X-ray diffraction (XRD), infrared (IR) spectroscopy, Raman spectroscopy and nuclear magnetic resonance (NMR) (Shiau, 2018).
In this work, the alkaloids caffeine and theobromine were characterized by XRD, in addition, the interaction of these alkaloids with molecular adenosine A2AR receptors and 3,7-dimethylxanthine methyltransferase (DXMT1) was evaluated.
MATERIALS AND METHODS
XRD analyzes
The XRD analyzes of the investigated samples were compared with those of the analytical standard of caffeine and theobromine of the Sigma brand provided by Dr. Alessandra Santos Lopes, from the Food Engineering course at the Federal University of Pará (UFPA).
These analyzes of caffeine and theobromine were performed with a BRUKER D2 PHASER diffractometer, equipped with a goniometer (θ / θ), radius: 141.1nm, and a ceramic anode copper X-ray tube (Cu-Kα1) , characteristic emission line of 1.540598 Å / 8.047 keV and maximum power of 300W (30 kV x 10 mA). The detector used was the Linear Lynxeye with an opening of 5 ° 2θ and 192 channels. The identification of the phases, as well as the unit cell parameters, was obtained from the X’Pert High Score Plus® program of the Laboratory of Mineralogical Characterization of the Institute of Geosciences at UFPA. Sample preparation and XRD analysis were carried out at the Laboratory of Mineralogy, Geochemistry and Applications (LAMIGA-UFPA) of the UFPA Geosciences Institute.
Information on the alkaloids molecules was collected from the U.S. National Library of Medicine, National Center for Biotechnology Information (https://pubchem.ncbi.nlm.nih.gov, accessed 12/1/20).
The theoretical XRD data were compared to the experimental ones via linear regression with the statistical parameter degree of adjustment (R2) obtained with the aid of the MINITAB 14.20 software.
Molecular interactions
The structures of caffeine and theobromine interacting with adenosine A2AR receptors (ID: 5MZP) and 3,7-dimethylxanthine methyltransferase (DXMT1) (ID: 2EFJ) were found in the Protein Data Bank (PDB). Molecular interactions were observed using PDBSum.
RESULTS AND DISCUSSIONS
X ray diffraction characteristics
The diffractogram of the caffeine crystal sample (Figure 1A) shows the most intense reflections at 2θ = 11.7616 ° (d = 7.51 Å; I% = 80.13) and 2θ = 11.9416 ° (d = 7.40 Å; I% = 98.14); medium intensity 2θ = 24.0416 ° (d = 3.69 Å; I% = 5.25), 2θ = 26.3816 ° (d = 3.37 Å; I% = 14.14), 2θ = 27 .0016 ° (d = 3.29 Å; I% = 12.23); and of lower intensities with values d = 10.61, 7.10, 6.14, 5.61, 4.49, 4.32, 3.76, 3.14, 3.01 and 2.46 Å, which are fully compatible with the data in the standard PPC1 cod. 00-029-1549 X’Pert High Score Plus®. The morphology of the crystal and the high crystallinity of the sample analyzed are demonstrated by its good compliance with the sample (Figure 1B). Literature data found in analysis of XRD characterizations of the caffeine compound peaks in the wide reflection range (2θ = 4 ° to 60 °) (Evstigneev et al., 2001; Nonappa, 2016).
Results presented by Lehmann and Stowasser (2007) for caffeine show that the alkaloid has the crystallized β anhydrous form, with five crystallographic ally unequal molecules in the form of a monoclinic center, space group α: 900, β: 97,8250 ( 4) and γ: 900, with unit cell dimensions: a: 43.0390 Å (9), b: 15.0676 Å (3) and c: 6.95314 Å (14).
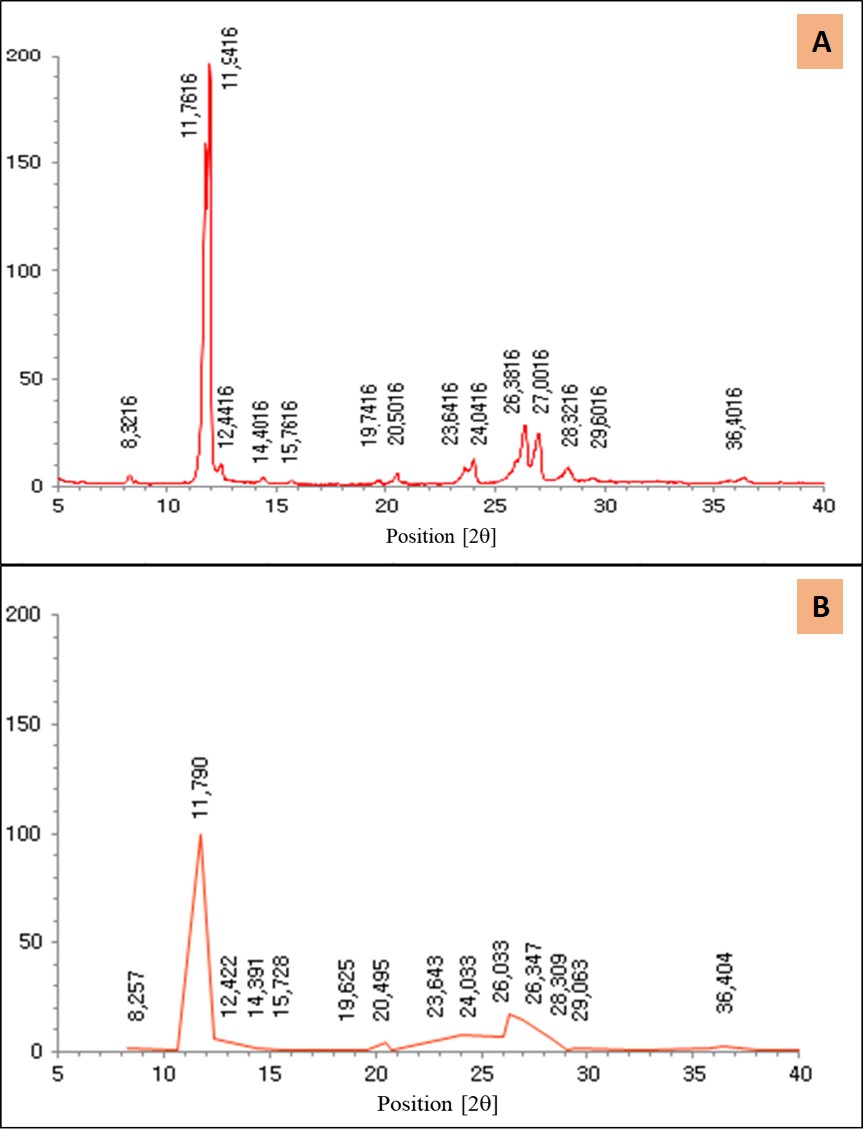
Figure 1. X-ray diffractograms of caffeine: (A) Obtained in this work; (B) and of the standard PPC1 plug cod. 00-029-1549. On y axis: electronic counts.
The diffractogram of the theobromine crystal sample (Figure 2A) stands out for the highest intensity peaks at 2θ = 13.4616 ° (d = 6.57 Å; I% = 98.92) and 2θ = 27.0816 ° (d = 3.28 Å; I% = 67.23); medium intensity at 2θ = 10.6616 ° (d = 8.29 Å; I% = 18.57), 2θ = 16.4816 ° (d = 5.37 Å; I% = 8.42), 2θ = 19.1216 ° (d = 4.63 Å; I% = 15.35), 2θ = 19.6216 ° (d = 5.52 Å; I% = 9.48), 2θ = 23.6116 ° (d = 3.76 Å; I% = 18.26), 2θ = 27.5016 ° (d = 3.28 Å; I% = 18.56), while those of lower intensities are 9.30, 6.03, 4.16, 2.94, 2.83, 2.57, 2.49, 2.20, 2.01, 1.81 and 1.64 Å respectively. All XRD reflections found are fully compatible with those of the standard PPC1 cod. 00-007-0692 of the X’Pert High Score Plus® program (Figure 2B), in which the investigated sample demonstrates a higher qualitative degree of crystallinity than the standard sample. Literature data found in analysis of DRX characterizations of the theobromine compound peaks in the wide reflection range (2θ = 4 ° to 60 °) (Wishart et al., 2009; Muthurajan et al., 2004).
Theobromine has spatial group α: 900, β: 91,750 (3) and γ: 900 with unit cell dimensions: a: 9,2990 (14) Å, b: 18,6980 (10) Å and c: 9,0381 (16 ) Å, (Lehmann and Stowasser, 2007; Latosinska et al., 2014).
Even though they are purine based alkaloids, caffeine and theobromine differ due to the presence of an extra methyl in the caffeine molecule, causing the values of angle 2q to shift to the main peaks of theobromine, as well as an increase in intensity, mainly in 27.016 (2θ), theobromine also shows a peak in the region 10.6 (2θ), which does not occur in caffeine (Figure 3).
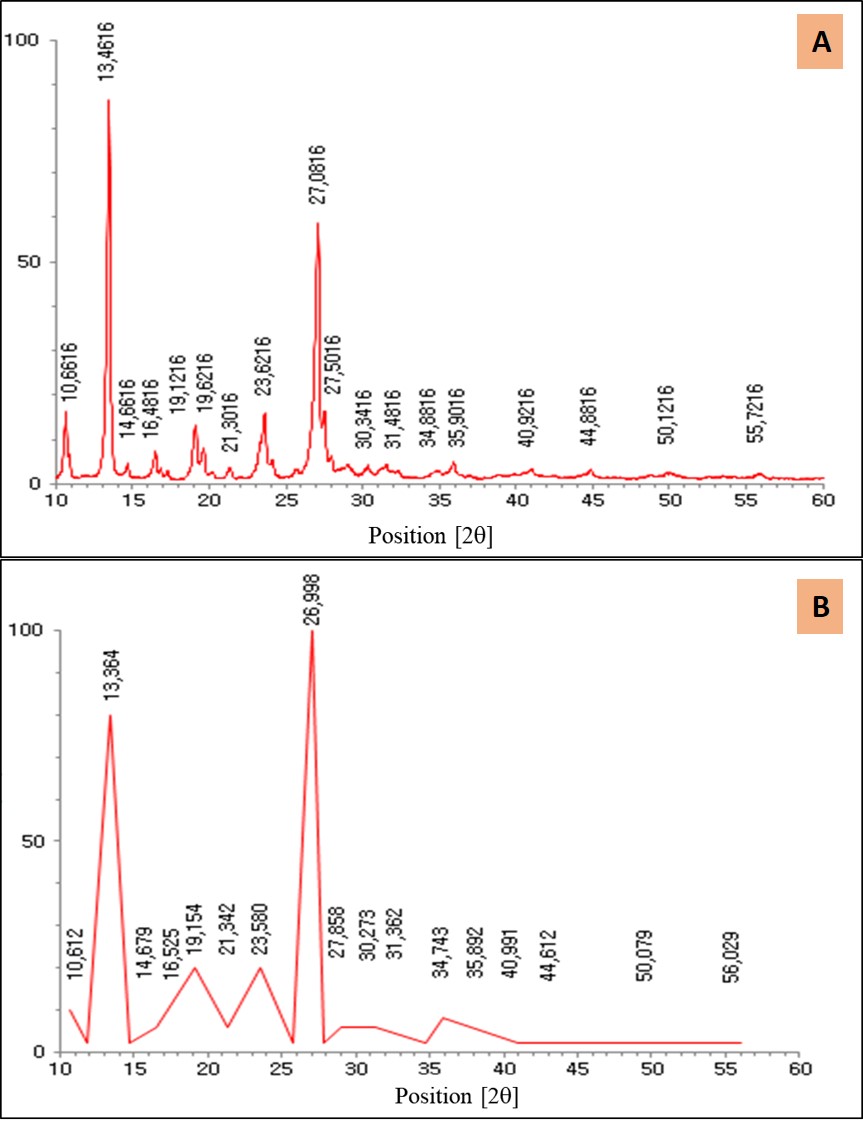
Figure 2. X-ray diffractograms of theobromine: (A) Obtained in this work; (B) and of the standard PPC1 plug cod. 00-007-0692. On y axis electronic counts.
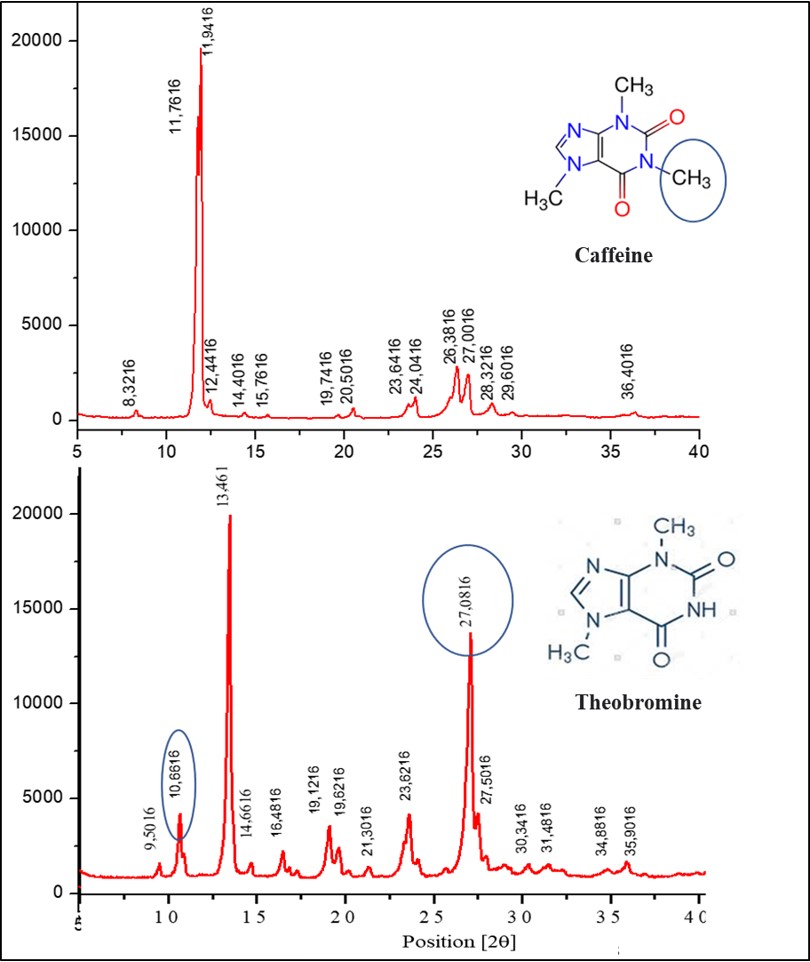
Figure 3. Confrontation between X-ray diffractograms of caffeine and theobromine samples. On y axis electronic counts.
For the cross-validation and proof of the quality of the caffeine and theobromine samples, the calculated statistical results reveal that both linear models for data of specific angles peaks in 2θ of the samples, presented good linear correlation (R2> 98%) and satisfactory results after the cross-validation procedure. The best set of predicted results was obtained for the caffeine substance that showed R2 = 99.84 while for the data of specific angles in 2θ of the substance theobromine the R2 was 99.82 (Figure 4).
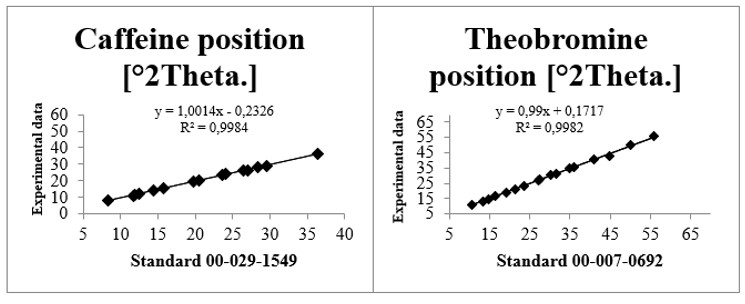
Figure 4. Linear regression between experimental and theoretical (standard) results (patterns) of XRD for caffeine (00-029-1549) and theobromine (00-007-0692).
It is noticed after evaluating the statistical data that, in general, the regression model for the data of specific angles in 2θ of the samples are significant and are well adjusted. This analysis indicates that there is a linear agreement between the experimental XRD data under study and the theoretical ones (standards), since they are quantitatively similar, being yet another proof of the good crystalline property of the tested samples.
Investigation of the interaction of caffeine and theobromine with biological receptors
The interaction between the crystalline structure of caffeine and theobromine, respectively, with adenosine A2AR and 3,7-dimethylxanthine methyltransferase (DXMT1) receptors were found in the Protein Data Bank (PDB) with the following PDB ID’s: 5MZP (Cheng et al., 2017) and 2EFJ (McCarthy and McCarthy, 2007). Caffeine showed important interactions with residues present in the active site of the adenosine receptor, as can be seen in Figure 5.
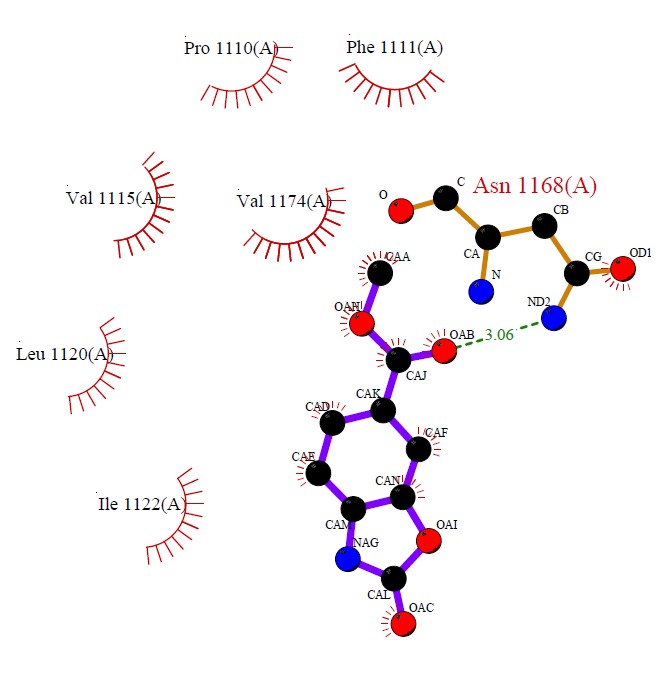
Figure 5. Intermolecular interactions between caffeine and A2AR adenosine binding site residues.
The molecule established hydrophobic interactions with the residues of Pro1110, Phe1111, Val1115, Val1174, Leu1120 and Ile 1122. With Asn1168 a hydrogen interaction was established.In the active site of DXMT1, theobromine presented several hydrophobic and hydrogen interactions, as seen in Figure 6.
Predominantly the main interactions responsible for the formation of the theobromine-DXMT1 complex were hydrophobic interactions. These interactions were established with the following residues: Tyr157, Cys61, Asn90, Tyr141, Gly138, leu101, Leu7, Trp161, His8, Met9 and Ala62. Hydrogen interactions were also established, with the following residues: Phe140, Ser139, Cys158, Cys156, Gly60, Tyr18, Asn66 and Asp100.
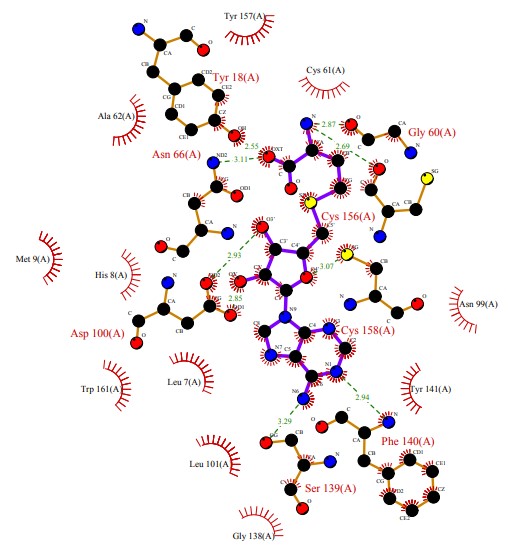
Figure 6. Intermolecular interactions between theobromine and residues from the DXMT1 binding site.
CONCLUSIONS
The analyzes obtained by XRD for the investigated materials demonstrated that they correspond to the standard sheets of the X’Pert High Score Plus® program for caffeine and theobromine. The presence of an extra methyl in the structure of the caffeine purine base suggests a shift in the values of the angle 2q for the main peaks of theobromine, as well as an increase in intensity, mainly in 27.016 (2q), theobromine also presents a peak in the region 10.6, which does not occur in caffeine. The experimental results presented by the XRD diffractograms show that caffeine has characteristics of purity as a function of the results of the regression analysis with R2 = 99.84, similar results were presented by the regression analysis of the theobromine diffractogram with R2 = 99.82. Using molecular modeling techniques, it was possible to observe that caffeine and theobromine showed interactions with important residues of the protein binding cavity, A2AR adenosine receptors and 3,7-dimethylxanthine methyltransferase (DXMT1).
Acknowledgements
To the Graduate Program in Chemistry at the Federal University of Pará (UFPA) and to CNPQ (Brazilian National Council for Scientific and Technological Development) for financial supports (Grant 305015/2016-8 and Project 442871/2018-0 to ML Costa).
REFERENCES
Ameh E.S. 2019. A review of basic crystallography and x-ray diffraction applications. International Journal of Advanced Manufacturing Technology, 105:3289-3302.
Buckley G. 1989. MARTINDALE: THE EXTRA PHARMACOPOEIA (29th edition). The Journal of the Royal College of General Practitioners, 39(327), 440.
Caudle A.G., Gu Y., Bell L.N. 2001. Improved analysis of theobromine and caffeine in chocolate food products formulated with cocoa powder. Food Research International, 34:599-603.
Cheng R.K.Y., Segala E., Robertson N., Deflorian F., Doré A.S., Errey J.C., Fiez-Vandal C., Marshall F.H., Cooke R.M. 2017. Structures of human A1 and A2A adenosine receptors with xanthines reveal determinants of selectivity. Structure, 25:1275-1285.
De Maria, C A. B.; Moreira, RF. A.. 2007. Cafeína: revisão sobre métodos de análise. Quím. Nova, São Paulo , v. 30, n. 1, p. 99-105,
Debnath B., Singh W.S., Das M., Goswami S., Singh M.K., Maiti D., Manna K. 2018. Role of plant alkaloids on human health: A review of biological activities. Materials Today Chemistry, 9:56-72.
Dewick, P. 2009. Medicinal Natural Products: A Biosynthetic Approach. Wiley; 3 ed, 550p.
Evstigneev M.P., Veselkov D.A., Djimant L.N., Davies D.B., Veselkov A.N. 2001. 1H NMR analysis of heteroassociation of caffeine with mitoxanthrone in aqueous solution. Journal of Structural Chemistry, 42:777-783.
Grases F, Rodriguez A, Costa-Bauza A. 2014. Theobromine inhibits uric acid crystallization. A potential application in the treatment of uric acid nephrolithiasis. PLoS One. Oct 21;9(10):e111184. In Chung F. H., Smith D.K. (eds.). 1999. Industrial applications of X-ray diffraction.
Latosinska J.N, Latosinska M., Olejniczak G.A., Seliger J., Zagar V. 2014. Topology of the interactions pattern in pharmaceutically relevant polymorphs of methylxanthines (caffeine, theobromine, and theophiline): Combined experimental (1H−14N nuclear quadrupole double resonance) and computational (DFT and Hirshfeld-Based) study. Journal of Chemical Information and Modeling, 54:2570−2584.
Lehmann C.W., Stowasser F. 2007. The crystal structure of anhydrous β-caffeine as determined from X-ray powder-diffraction data. Chemistry-A European Journal, 13:2908-2911.
Mazzafera P., Baumann T.W., Shimizu M.M., Silvarolla M.B. 2009. Decaf and the steeplechase towards decaffito-the coffee from caffeine-free arabica plants. Tropical Plant Biology, 2:63-76.
McCarthy A.A., McCarthy J.G. 2007. The structure of two N-methyltransferases from the caffeine biosynthetic pathway. Plant Physiology, 144:879-889.
Muthurajan T., Mohanraj V., Aravindan B., Jayaprakash C., Thenmozhi M. 2014. In silico drug design and extraction of piperine an inhibitor for fernesyltransferase in cryptococcus neoformans. www.wjpr.net (accessed June 2, 2019).
Nonappa, Kolehmainen E. 2016. Caffeine as a Gelator. Gels.;2(1):9.
Shiau L.D. 2018. Determination of the nucleation and growth kinetics for aqueous L-glycine solutions from the turbidity induction time data. Crystals, 8:403.
Silvarolla M.B., Mazzafera P., Fazuoli L.C. 2004. A naturally decaffeinated arabica coffee. Nature, 429:826.
Teixeira G.A. 2014. Cristalização em leito vibrado: uso de soro de queijo purificado na separação de lactose. Tese Doutorado, Universidade Federal de Uberlândia, Minas Gerais, 240 p.
Tewari B.B., Beaulieu-Houle G., Larsen A., Kengne-Momo R., Auclair K., Butler I.S. 2012. An overview of molecular spectroscopic studies on theobromine and related alkaloids. Applied Spectroscopy Reviews, 47:163-179.
Vijayakumar, A., & Moses, V. (2014). A Study on Caffeine Effect of Tea on Health.
Wishart D.S., Knox C., Guo A.C., Eisner R., Young N., Gautam B., Hau D.D., Psychogios N., Dong E., Bouatra S., Mandal R., Sinelnikov I., Xia J., Jia L., Cruz J.A., Lim E., Sobsey C.A., Shrivastava S., Huang P., Liu P., Fang L., Peng J., Fradette R., Cheng D., Tzur D., Clements M., Lewis A., De Souza A., Zuniga A., Dawe M., Xiong Y., Clive D., Greiner R., Nazyrova A., Shaykhutdinov R., Li L., Vogel H.J., Forsythei I. 2009. HMDB: A knowledgebase for the human metabolome. Nucleic Acids Research, 37:603-610.
Zarbin A. J. G. 2007. (Nano)materials chemistry. Química Nova, 30:1469-1479.
Chung, F.H.; Smith, F. (Ed.). (1999). Industrial Applications of X-Ray Diffraction (1st ed.). CRC Press. https://doi.org/10.1201/b16940
PubChem Compound Summary for CID 2519, Caffeine. Retrieved january 1, 2020 from https://pubchem.ncbi.nlm.nih.gov/compound/Alkaloids.